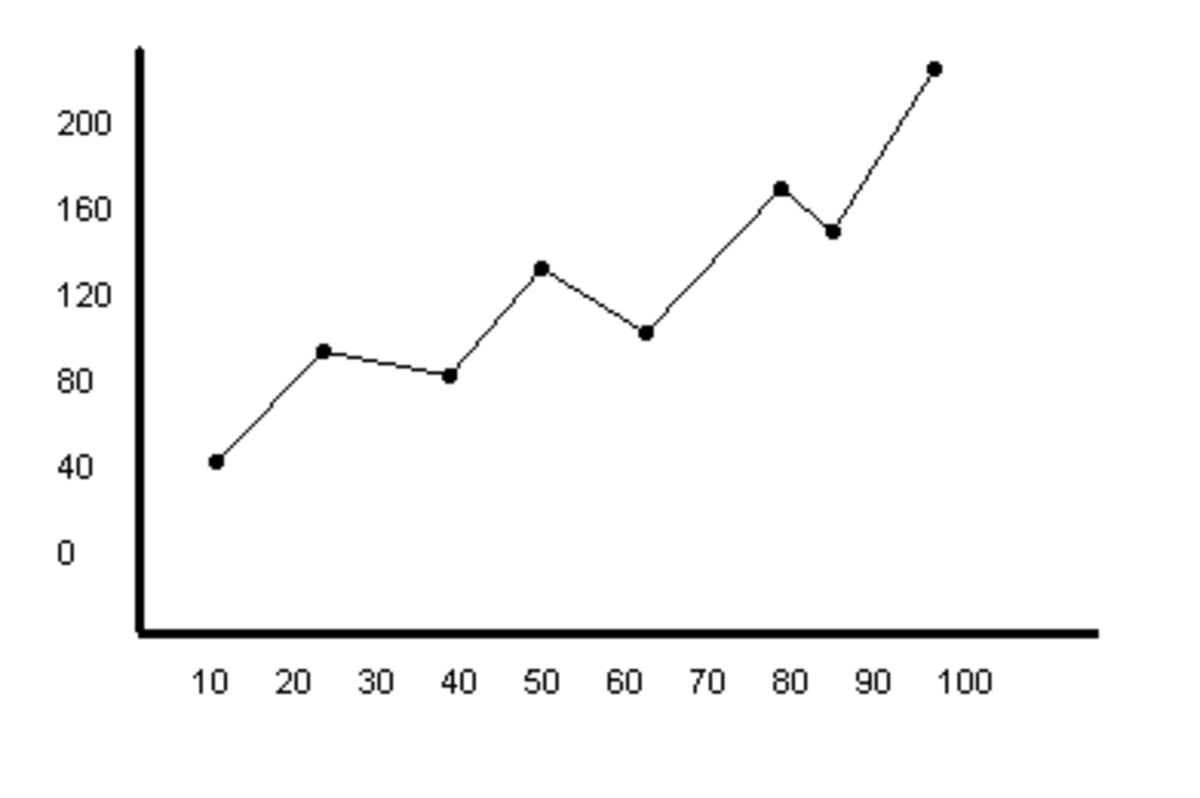
A very poor, but not unique, example of a graph

Graphs - learn to love them!
I hear this moan more than any other - it also is one of the most exasperating:
"Why do we have to draw graphs in Science - it's not maths!"
With Ofsted going on about 'integrated curricula' it is important that students do not see subjects as insular and cut off from each other. The skills learnt in Math, English and Technology are readily and necessarily transferable to the Scientific arena.
Graphs are one of the most important tools available to scientists (young and old) to display data. They are:
- Easy to interpret
- Display a large amount of information in a small (ish) space
- Easy to draw!
- Worth LOADS of marks in coursework and in exams (typically 4-8marks)
It is a source of endless annoyance seeing a pupil miss a grade boundary by a couple of marks only to scrutinise the paper and see 3 marks thrown away due to poor graphing. This article will take you through the golden rules of drawing graphs, applicable to all exam boards, all situations, all the time. They are even up on my classroom wall as my 'Tips for the Top'
Common Mistakes, and how to avoid them
At least half the marks for any graph question are awarded for presenting your graph according to standard conventions; this is before the actual content has even been assessed. Before moving on from any graph question or from a graph section of your coursework, ensure you have followed the 6 Graph Commandments
- Thou shalt draw your graph in pencil with a ruler.
- Thou shalt use all thy graph paper.
- Thou shalt label your axes.
- Thou shalt always give units.
- Thou shalt not draw bar graphs.
- Thou shalt not play dot-to-dot with thy data points!

Be Specific
If you have ticked off each of the Commandments, you are halfway to achieving a good overall mark for this particular graph. But now it is time to pick up question specific marks...
- Give your graph a descriptive title. E.g.: A Graph to show the effect of x on y
- Ensure you have put your graph the right way around. Your x axis should always show the independent variable - this is the variable you are changing. Your y axis should always plot the dependent variable - this is the variable you are measuring. For example, when looking at the effect of temperature on rate of reaction (a classic chemistry investigation), you change the temperature and measure the rate. As such, temperature goes on your x axis (it is independent) and rate goes on your y axis (it is dependent)
- Ensure you plot your data carefully, along the corridor and up the stairs. Mark your data point with a small x. If you are plotting multiple data sets on one graph (a prerequisite for the highest marks in some syllabi) then use a small o or l or similar to distiguish between data sets.
- If plotting multiple data sets, WRITE OUT A KEY/LEGEND!
- Do not play dot-to-dot. I know I have stated this before, but I so often see jagged connected lines on graphs from my students. Only very rarely are data points connected in this way. More often, we are seeking the trend or pattern that our results show, for that we need...
- DRAW A LINE OF BEST FIT. These lines pass through or near as many data points as possible. They can either be straight lined, or a smooth curve. Look for the pattern to decide which is most appropriate.
- TIP FOR THE TOP: circle your anomalous results (any outliers that do not fit your trend) and label them in your key/legend. This will net you extra points for seconds extra work.

Don't forget to ask
Depending on the coursework you are completing, the criteria for accessing the very top marks differ. For rates of reaction, you are required to find the gradient of your graph; For osmosis and other biological investigations you are required to add error bars; still other investigations require statistical interventions such as Chi-Squared tests. Graphs are such easy places to pick up precious points that it would be foolish to not ask your teacher/lecturer/professor etc what the marking criteria are for the highest echelons. Don't waste marks by not asking - by following all the above advice, you have already attained 6/8 marks: now shoot for the last two!
Happy Graphing!


0 comments:
Post a Comment